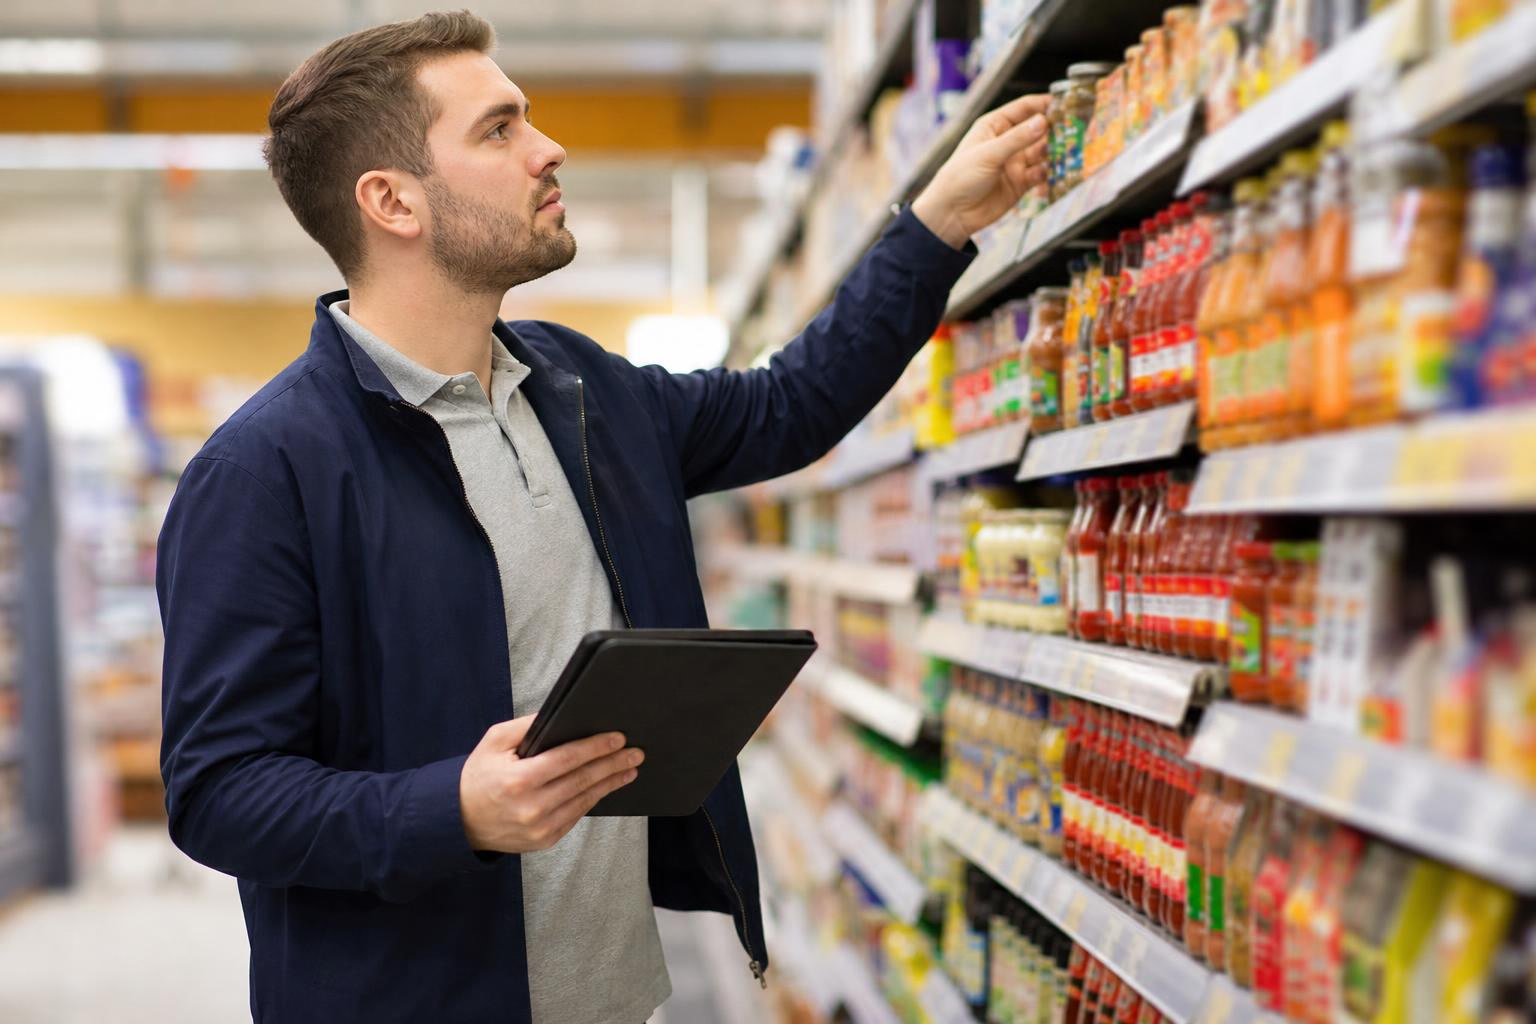

TL;DR: Product titles, images, reviews, and conversion rate are the four pillars of every product detail page. Each element has a measurable, well-documented impact on whether shoppers add to basket or bounce. This glossary defines every key term, connects them with hard data, and explains the specific challenges FMCG brands face on the UK digital shelf, where grocery review rates sit at just 0.1% to 0.3%.
Every product page on every UK retailer website is built from the same raw materials: a title, images, reviews, a price, and a description. Together, these elements determine your conversion rate. Yet only 18% of companies have product detail pages considered “good” or “acceptable,” according to Salsify research. That gap between how much PDPs matter and how little attention they receive is where this glossary lives.
Whether you manage digital shelf performance at a challenger brand or oversee e-commerce across a portfolio of SKUs at a major CPG, this page is meant to be your single reference for understanding how product title, image, reviews, and conversion interact, and what the data says about each one.
If you already know your review coverage needs work, Brand Allies’ reviews service generates verified reviews on UK retailer PDPs through a community of 250,000+ real shoppers.
Conversion Rate
Definition: Conversion rate is the percentage of visitors to a product page (or site) who complete a desired action, typically adding to basket or completing a purchase.
Formula: (Conversions ÷ Visitors) × 100 = Conversion Rate
Benchmarks worth knowing:
- The average e-commerce product page converts between 1.5% and 3%. Top performers hit 4% to 8%.
- The median control conversion rate across tested PDPs is 4.7%.
- Food and beverage achieved the highest e-commerce conversion rate of any sector in 2024 at 8.98%.
Conversion rate is the outcome metric. Every other term in this glossary is an input that moves it up or down. When people search for “product title image reviews conversion,” they are really asking: which PDP inputs have the biggest effect on this number? The rest of this glossary answers that question with specifics.
Product Detail Page (PDP)
Definition: A product detail page is a specific webpage dedicated to a single product. It is where shoppers see images, the title, price, description, and reviews, and decide whether to buy. In FMCG e-commerce, the PDP is the digital equivalent of picking up a product from the shelf and reading the back of the pack.
Why it matters for grocery brands: More discovery now happens digitally, through search, recommendations, and retail media, before a shopper ever sees a product on a physical shelf. The PDP is the first real impression for a growing share of purchases.
PDP vs PLP: A product listing page (PLP) shows multiple products in a category grid. A PDP is the individual page you land on after clicking a specific item. On the PLP, only your hero image and product title are visible. On the PDP, your full content arsenal (images, description, reviews, star rating) is in play.
For a detailed walkthrough of how one major UK retailer’s PDP works, see our guide on boosting Tesco page conversion.
Digital Shelf
Definition: The digital shelf is the complete set of online touchpoints where a product appears to shoppers, including retailer search results, category pages, product pages, and retail media placements. For FMCG brands selling through Tesco, Sainsbury’s, Ocado, ASDA, Morrisons, Boots, and others, the digital shelf is the new front door to the shopper.
The grocery-specific reality: In online grocery shopping, many decisions are habitual and fast. Most products that make their way into baskets are added without shoppers ever opening the product page. That makes the hero image and product title, alongside retailer-controlled cues like price, favourites, and recommendations, critical to digital shelf visibility.
This is why product title, image, reviews, and conversion cannot be treated as separate workstreams. They form a system. A strong title wins the click from the listing page. A strong image confirms the expectation. Strong reviews close the sale.
Product Title
Definition: A product title is the main name of a product shown on a listing. It typically includes brand name, product type, key attributes, size, flavour, or variant. This text appears at the top of a product page, in search results on marketplaces, and in organic or paid shopping ads.
Why titles drive conversion:
Product titles directly influence discoverability, click-through rate, and buyer expectations. A clear, complete title reduces cognitive load and encourages clicks. A well-crafted title attracts the right customers, tells them what product you are looking at, and gives them a reason to click through.
Best practices by the numbers:
- Keep title length between 50 and 75 characters so the full title displays in search results without truncation.
- Place key details and target keywords at the beginning for better visibility.
- Write titles a person would say out loud. Keyword-stuffed titles might rank but then fail to convert the clicks they earn.
The FMCG title neglect problem: Unlike Amazon, where sellers own and actively optimise their titles, grocery product titles are often set by the retailer’s data team and never revisited. Practitioners on Reddit and in e-commerce forums frequently note that getting a title changed on a retailer’s system can take weeks of back-and-forth with buyer teams. This structural friction means many FMCG brands are running suboptimal titles indefinitely.
The most directly actionable PDP factors (product titles and reviews) are also the ones many FMCG brands neglect. Titles get locked in during onboarding. Reviews are left to accumulate organically at that painfully slow 0.1% to 0.3% rate.
For Sainsbury’s-specific guidance on product title optimisation, read our Sainsbury’s conversion guide.
Hero Image
Definition: The hero image is the primary product image, the first (and often only) image a shopper sees on the category listing page and at the top of the PDP. In grocery e-commerce, the hero image does more heavy lifting than in almost any other category because most shoppers add from the listing page without clicking through.
The conversion impact is dramatic. One major supplier lifted conversion by 70% on a single milk SKU by redesigning one hero image for Tesco.com. That is a single image change on a single product.
The thumbnail problem: FMCG brands regularly reuse physical-shelf assets that were never designed for a 1cm digital thumbnail. A beautifully designed pack that works at arm’s length on a supermarket shelf can be illegible at 100 pixels on a phone screen. The fix is treating the digital shelf as a design brief in its own right, not an export setting.
For a health-and-beauty example of hero image optimisation, see our Boots conversion guide.
Product Image
Definition: Product images are the full set of visuals on a product detail page, including the hero image, alternate angles, lifestyle shots, ingredient or nutrition close-ups, and size-comparison images.
Product images are the second most influential conversion element on a PDP after price, and they serve as a meaningful ranking factor through Google Image Search.
The data is consistent across studies:
- Products with 5 or more images convert at roughly 60% higher rates than products with a single image.
- Product pages with high-resolution, zoomable images and 360-degree views see 40% higher conversion rates than those with basic imagery.
- 74% of online shoppers say they need to see multiple angles before deciding. Offering multiple photos from different angles can lift sales by about 58%.
- According to Salsify’s 2026 consumer research, 61% of shoppers say product images and videos are the most important PDP element when deciding whether to complete a purchase.
Image types that move the needle: eMarketer’s research on visual commerce identifies three image characteristics that most strongly predict conversion: multiple angles, consistent white backgrounds, and lifestyle context shots. Reviewer-submitted photos carry more weight than brand imagery, particularly in categories where buyers are sceptical of polished brand shots.
For FMCG brands, product image optimisation is often an afterthought. The photography budget goes to pack design and trade press. The PDP gets a single pack shot exported from the artwork file.
Product Reviews
Definition: Product reviews are customer-submitted feedback (text, star ratings, photos, videos) displayed on a product page. They provide social proof that shapes buying decisions for every subsequent shopper who lands on that page.
Reviews are the single most influential PDP element for conversion after the product itself.
The headline stats:
- Products with reviews see 270% higher conversion rates than products without reviews, according to Spiegel Research Center at Northwestern University.
- For higher-priced products, the gap widens to 380%.
- When a page goes from 0 to 1 reviews, conversion lifts by over 50%. Add more than ten reviews and the lift reaches 255%.
- Products displaying more than 50 reviews achieve conversion rates 4.6 times higher than those with no reviews, regardless of whether the reviews are positive or mixed.
These numbers explain why product title, image, reviews, and conversion are so tightly linked. You can have a perfect title and stunning images, but a product page with zero reviews will still underperform dramatically.
Review Volume and the Credibility Threshold
Definition: Review volume is the total number of reviews on a product page. The credibility threshold is the minimum number of reviews (typically 20 to 30) at which shoppers begin to trust a product enough to buy.
How volume maps to conversion:
| Reviews | Conversion lift vs zero reviews |
|---|---|
| 1 review | +50% to +65% |
| 1 to 5 reviews | +85% to +95% |
| 11 to 30 reviews | +68% (vs zero) |
| 50+ reviews | 4.6x conversion rate |
| 101+ reviews (grocery) | +686% conversion lift |
The first five reviews generate the biggest conversion impact per review added. After that, each additional review contributes less individually, but cumulative volume continues to build trust and ranking signals.
For FMCG brands, the practical challenge is getting past that credibility threshold. With grocery review rates sitting at just 0.1% to 0.3% (compared to 2% to 5% on Amazon), reaching 30 reviews organically can take months or years. Our guide to earning your first 30 reviews on UK retailer PDPs explains how to close that gap.
Brands that want to build review volume across multiple retailers can explore Brand Allies’ Starter Plan as a first step.
Star Rating
Definition: A star rating is the 1-to-5 average score displayed on a product listing, calculated from all customer reviews.
The optimal range is 4.0 to 4.7, not 5.0.
This is one of the most counterintuitive findings in conversion research. PowerReviews’ analysis of 20+ million product pages across 1,000+ retail sites found that products with a perfect 5.0 star average convert at the same rate as products rated 3.0 to 3.49. The sweet spot sits between 4.2 and 4.5 stars.
Why? Almost all consumers (95%) become sceptical when a product has only glowing five-star reviews. They suspect censorship or fakery. A few three and four-star reviews actually increase trust because they signal authenticity.
Other star rating data points:
- A one-star improvement leads to a 5% to 9% boost in sales in the short term.
- The difference between a 3.9 and 4.1 star rating creates the most significant sales impact. Products with four-star averages receive 11.6 times more orders than those with three-star ratings.
- Showing the aggregate star rating and review count next to the product title and price, visible without scrolling, increases add-to-cart rates by 15% to 25%.
That last point matters for FMCG brands negotiating with retailers about PDP layout. Star ratings belong above the fold, next to the title and price.
Review Recency
Definition: Review recency refers to how recently reviews have been posted on a product page. It measures freshness and signals ongoing customer engagement.
The data here is striking:
- 97% of consumers consider review recency at least somewhat important.
- 86% place even more importance on recency when buying a product or brand for the first time, which is critical for NPD launches.
- Nearly half (44%) want reviews published within the last month.
- Reviews older than three months are perceived as 30% to 40% less credible.
The 45-day cliff: A review flow broken for more than 45 days results in an average 18% conversion rate decrease on the affected products. E-commerce sites displaying a majority of reviews older than six months experience an average 34% conversion drop compared to sites maintaining a steady flow of fresh reviews.
A steady trickle of recent reviews outperforms a one-time stockpile. This is the core insight for any FMCG brand running a review generation programme. One burst of 50 reviews that then goes silent for four months will lose much of its conversion value.
For brands that need ongoing review velocity rather than a one-off push, the Growth Plan is designed to maintain that steady flow across multiple retailers.
Verified Reviews
Definition: A verified review is a review confirmed to come from a customer who actually purchased the product, typically flagged with a “verified buyer” or “verified purchase” badge on the product page.
Verified reviews add a 15% conversion lift over unverified reviews. Verified buyers are more likely to give four or five-star ratings than anonymous reviewers. Anonymous reviewers, conversely, are significantly more likely to give one and two-star reviews.
This matters for compliance too. The ASA’s CAP Code and CMA guidance require transparency around incentivised or compensated reviews. For a full breakdown of the rules, our guide on authentic product reviews covers what counts as compliant in the UK.
UGC (User-Generated Content)
Definition: User-generated content includes any content created by customers rather than the brand: text reviews, star ratings, photos, videos, and Q&A responses on a product page.
The conversion numbers:
- The simple presence of UGC increases conversions on product pages by 8.5%, based on PowerReviews’ analysis of over 1.5 million product pages from 1,200 retailers.
- User-generated images on product pages increase conversions by 106.3% among users who interact with them.
- Visitors who interact with reviews convert at a rate 108% higher than those who do not.
- Products with photo and video reviews see 2.5x the conversion rate of products with text-only reviews.
For FMCG brands, the practical takeaway is clear: encouraging shoppers to include photos with their reviews roughly doubles their conversion impact compared to text-only feedback. Brands evaluating review solutions should read our comparison of FMCG review platforms for the UK market.
The FMCG Review Problem: Why Grocery Is Different
This is where generic e-commerce conversion advice breaks down. Grocery and CPG brands face a structural challenge that electronics, fashion, and beauty brands do not.
The numbers tell the story: The average grocery review rate is only 0.1% to 0.3%. On Amazon, the equivalent figure is 2% to 5%. That means a grocery product selling 10,000 units might generate 10 to 30 reviews organically. An Amazon product selling the same volume would generate 200 to 500.
Retailer-by-retailer fragmentation makes it worse. A brand may have strong review coverage on Tesco but weak coverage on Sainsbury’s. The same SKU might have recent reviews on ASDA and stale reviews on Ocado. Each retailer is a separate ecosystem with its own review infrastructure, moderation rules, and shopper behaviour. There is no automatic syndication.
Most FMCG launch plans miss reviews entirely. They cover packaging, pricing, distribution, and in-store merchandising. Almost none include review readiness as a launch requirement. A product can hit shelves (physical and digital) with zero reviews and stay that way for months. For guidance on building reviews into your launch plan, see our grocery product launch reviews guide.
How Product Title, Image, Reviews, and Conversion Work Together
These PDP elements do not operate in isolation. They form a conversion chain with a clear sequence:
-
The product title wins (or loses) the click from the search results or category page. A clear, descriptive title with the right keywords gets the product seen. A generic or truncated title gets scrolled past.
-
The hero image confirms the expectation. On the listing page, the image and title together determine whether the shopper clicks through. In grocery, where many purchases happen directly from the listing page, the image might be the only thing the shopper evaluates.
-
Reviews close the sale. Once a shopper lands on the PDP, the star rating, review count, and review content provide the social proof needed to overcome hesitation. For first-time buyers, recent reviews from verified purchasers matter most.
-
Conversion is the result of all three elements working together. The effect is multiplicative, not additive. A great title with no reviews underperforms. Strong reviews with a terrible hero image underperform. The brands that win on the digital shelf get all three elements right simultaneously.
The biggest blocker for most FMCG brands is the review layer. Titles can be fixed with a data update. Images can be redesigned. But building a base of authentic, recent, verified reviews across multiple UK retailers requires a sustained programme, not a one-off fix.
Quick-Reference Table
| Term | Definition | Conversion Impact |
|---|---|---|
| Conversion Rate | % of visitors who complete a desired action | Benchmark: 1.5–3% average, 8.98% food & beverage |
| Product Title | Main product name on a listing | 50–75 char titles maximise click-through and conversion |
| Hero Image | Primary product image on listing and PDP | Up to 70% conversion lift from a single redesign |
| Product Image (set) | All visual content on a PDP | 5+ images = 60% higher conversion vs single image |
| Product Reviews | Customer-submitted text, ratings, photos | 270% higher conversion with reviews vs without |
| Review Volume | Total number of reviews | 50+ reviews = 4.6x conversion rate |
| Credibility Threshold | Minimum 20–30 reviews for shopper trust | Below threshold, shoppers are significantly less likely to buy |
| Star Rating | 1-to-5 average score | 4.0–4.7 optimal; 5.0 converts same as 3.0–3.49 |
| Review Recency | How recently reviews were posted | 45-day gap = 18% conversion drop |
| Verified Review | Review from confirmed purchaser | 15% incremental conversion lift |
| UGC | All customer-created content on PDP | 8.5% baseline lift; photo reviews = 2.5x text-only |
| Digital Shelf | All online touchpoints for a product | The new front door for grocery shoppers |
Frequently Asked Questions
How many product reviews do you need to improve conversion?
The first review alone lifts conversion by 50% to 65%. The biggest jump per review comes in the first five. Products with 50+ reviews convert at 4.6 times the rate of products with none. For grocery specifically, reaching the 20 to 30 review credibility threshold is the most important milestone.
What is the ideal star rating for conversion?
Research consistently shows that 4.0 to 4.7 is the sweet spot. A perfect 5.0 rating actually hurts conversion because shoppers suspect the reviews are fake or curated. Products rated 5.0 convert at the same rate as products rated 3.0 to 3.49.
How long should a product title be for maximum conversion?
Between 50 and 75 characters. This ensures the full title is visible in search results without truncation. Place the most important keywords and product descriptors at the beginning. Avoid keyword stuffing, which can hurt click-through rates even if it helps search visibility.
How many product images should a PDP have?
Five or more. Products with 5+ images convert at roughly 60% higher rates than single-image listings. Include the hero shot, alternate angles, lifestyle context, and close-ups of key details like ingredients or nutrition panels.
Why do grocery products get so few reviews compared to Amazon?
The average grocery review rate is 0.1% to 0.3%, compared to 2% to 5% on Amazon. Grocery purchases are habitual and low-consideration, so shoppers rarely feel motivated to leave feedback. Additionally, each UK retailer has its own review system with no cross-retailer syndication, fragmenting coverage.
How does review recency affect conversion?
97% of consumers consider review recency at least somewhat important. When the most recent review is over six months old, conversion rates drop by an average of 34%. A gap of more than 45 days with no new reviews causes an average 18% conversion decline.
What is the digital shelf and why does it matter for FMCG?
The digital shelf is every online touchpoint where your product appears to shoppers, from retailer search results and category pages to PDPs and retail media placements. For FMCG brands selling through UK grocers, it is increasingly the first place shoppers encounter and evaluate your product, making product title, image, reviews, and conversion optimisation essential.
Should FMCG brands optimise product images differently for online vs physical shelf?
Yes. Pack designs created for physical shelves are often illegible at the thumbnail sizes used on retailer websites and apps. Brands should treat the digital shelf as a separate design brief, creating hero images optimised for small screens and fast scanning rather than simply exporting artwork files.
Building review coverage, optimising product titles and images, and maintaining fresh UGC across UK retailer PDPs is a sustained effort, not a one-time project. If your brand needs verified reviews on Tesco, Sainsbury’s, Boots, Ocado, or other UK retailers, explore Brand Allies’ review service to see how real shoppers can build your PDP conversion foundation.