
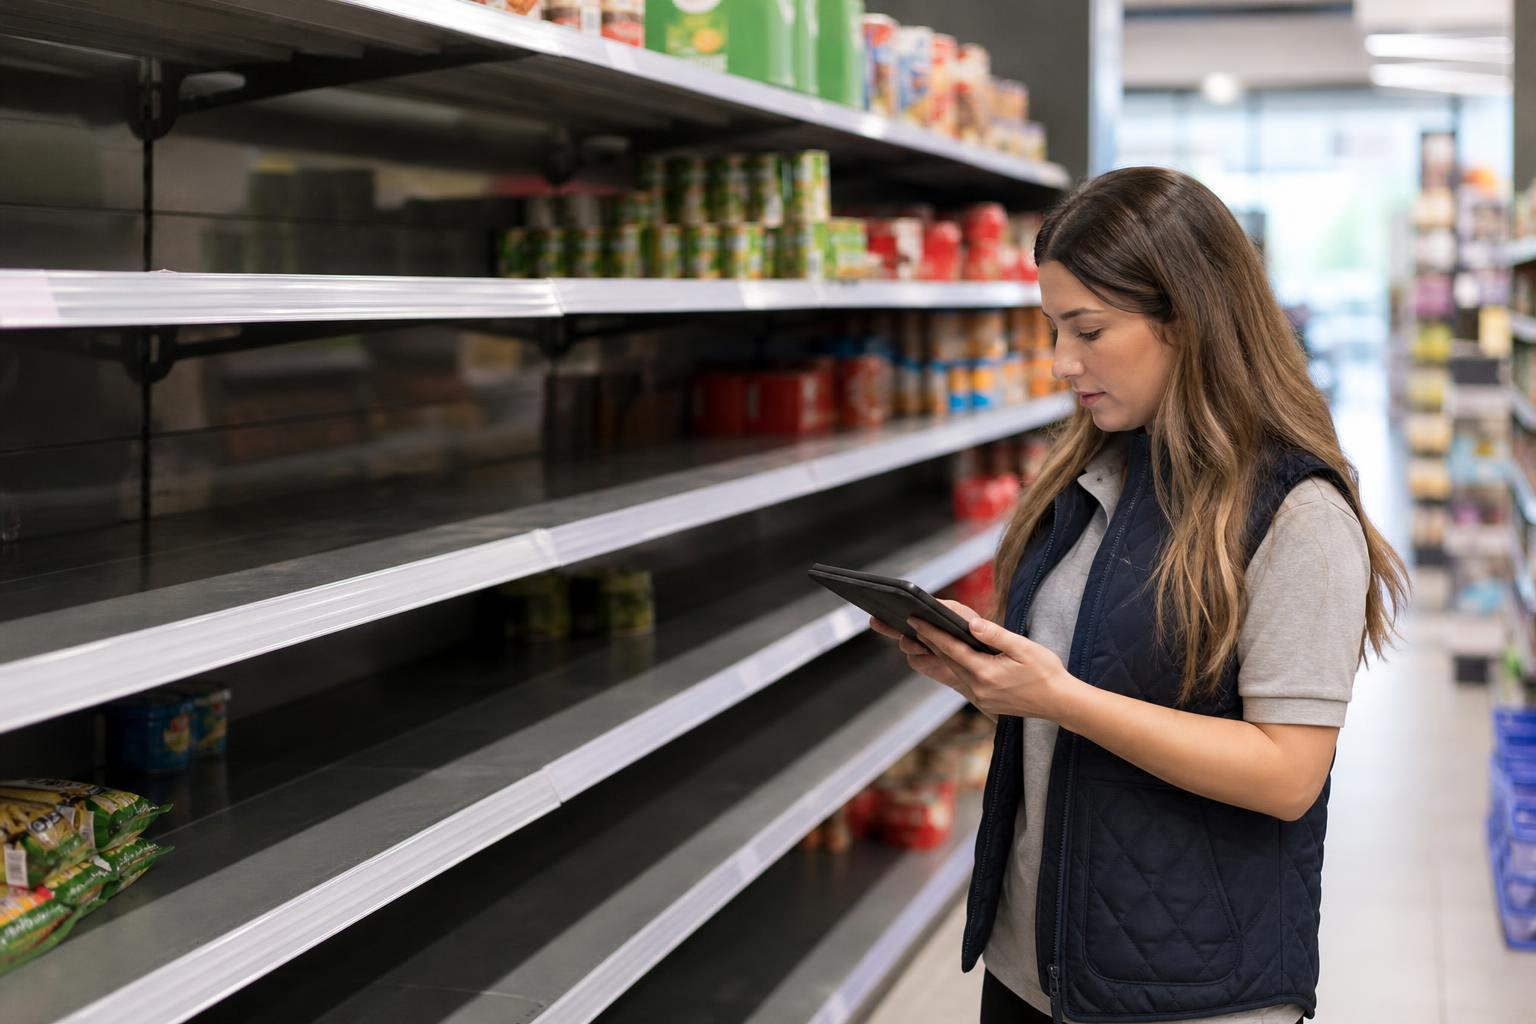
TL;DR: An out of stock audit in FMCG is a structured check to verify that a brand’s products are physically present and correctly displayed on retailer shelves. Stockouts average 8% across the industry and cost retailers roughly 4% of sales, with 70-90% of gaps caused by in-store replenishment failures rather than supply chain problems. This guide covers how OOS audits work from a brand-side perspective, the main audit methods available, UK-specific benchmarks, and how audit data feeds into retailer negotiations and range review defence.
For FMCG brands selling through UK grocery, the gap between what head office agrees with a retailer and what actually happens on the shelf can be enormous. Products go missing. Facings shrink. Promotional displays never get built. And because the brand doesn’t own the store, these problems can persist for days or weeks before anyone notices.
That gap is exactly what an out of stock audit is designed to close.
If you suspect shelf execution issues are quietly eroding your sales, an in-store compliance audit is the fastest way to quantify the problem.
What Is an Out of Stock Audit in FMCG?
An out of stock audit is a structured, repeatable process for checking whether a brand’s listed products are physically available to shoppers on retailer shelves. It goes beyond simple inventory counting. The audit verifies product presence, correct shelf positioning, facing counts, pricing accuracy, and promotional display compliance.
The distinction from a standard stock audit matters. A traditional stock audit is an internal exercise: a retailer or warehouse counting its own inventory. An FMCG out of stock audit works in the opposite direction. It is a brand checking what is happening on someone else’s shelves.
This is the perspective that most existing guides miss entirely. They treat stock auditing as a warehouse problem. For manufacturers, it is a retail execution problem, and the consequences fall squarely on the brand.
The scale of the issue
Out of stock rates in the FMCG industry average around 8% globally, but jump to roughly 10% for fast-selling lines and products on promotion. IHL Group’s 2026 research places global inventory distortion at $1.7 trillion, equal to 6.2% of global retail sales. Of that distortion, 65.6% is attributed to out-of-stocks and 34.4% to overstocks.
In the UK specifically, POPAI UK research suggests that in-store execution non-compliance runs as high as 50%. That means half of all agreed merchandising standards are not being met at any given time.
Why Out of Stock Audits Matter for FMCG Brands
Lost sales are larger than most brands estimate
A typical retailer loses about 4% of total sales due to having items out of stock, according to academic research. But the damage is not evenly distributed. Retailers still capture spending (shoppers switch to alternatives on the same shelf). Brands lose the sale entirely.
For context, CPG brands spend an estimated $7 billion annually on manually tracking shelf availability and product placement. Despite that investment, 8% of products remain out of stock at any given moment.
Shoppers switch brands, not stores
TELUS Consumer Goods’ 2026 Food & Beverage Study of 3,000 global consumers found that 45% of consumers will switch to a different brand when their desired product is out of stock. And here is the UK-specific number that should alarm every brand manager: 60% of UK consumers decide on brands at the shelf, the highest rate globally.
The DOSS Stockout Stigma Index puts the numbers even higher. About 62% of consumers said they have switched to a competing brand at least once because of a stockout, and 82% said they would try a competitor if their go-to product is frequently unavailable. Food and grocery is the most common category where shoppers hit stockouts, at 53%.
Promotional spend gets wasted
Out of stock rates jump from 8.3% to around 10% during promotions because forecasts underestimate uplift and stores fail to build secondary displays on time. Brands pay for the promotional activity (often through significant trade spend), then lose the sale because the product simply is not on the shelf. This makes promotional compliance audits one of the highest-ROI activities a brand can undertake.
Range review risk compounds over time
Persistent out of stocks create a vicious cycle. Low sales data (caused by shelf gaps, not lack of demand) makes a product look like a poor performer. That weakens the brand’s position during retailer range reviews. Without audit evidence proving that demand exists but execution failed, a brand can lose shelf space for reasons entirely outside its control. Understanding how retailer visibility affects sales is critical to breaking this cycle.
Common OOS Causes the Audit Should Catch
Shelf replenishment failures
This is the dominant cause, and it is not close. Harvard Business Review research found that 72% of out-of-stocks are caused by faulty in-store ordering and replenishment practices, not supply chain failures. Other studies put the figure as high as 90%. The product is in the back room. It just never made it to the shelf.
A comprehensive NACDS study confirmed this pattern: 75% of OOS causes are due to retail store practices rather than upstream supply issues.
Phantom inventory
This is a concept that deserves more attention than it gets. Phantom inventory occurs when the store’s system says stock exists, but nobody can find it. Maybe the units were damaged and discarded without being scanned out. Maybe they were placed in the wrong location. Maybe they were stolen.
The practical effect: the system sees no problem, so no reorder is triggered. The shelf stays empty. A normal out of stock is at least visible once someone checks the shelf. Phantom inventory is an out of stock that the system has decided does not exist. The longer it goes unseen, the more sales it quietly removes from the numbers.
This is precisely why physical audits remain essential even in an era of sophisticated inventory management systems.
Planogram non-compliance
The product might be in the store but in the wrong position, with fewer facings than agreed, or on the wrong shelf entirely. A shopper scanning the expected location sees nothing and moves on. For the brand, the result is the same as a true out of stock.
Promotional build failure
Secondary displays (end-caps, gondola ends, promotional bays) drive a significant proportion of incremental sales during campaigns. When these displays are not erected on time, or not erected at all, the promotional investment generates zero return.
Back-of-store stock not brought forward
Stock sits on pallets in the warehouse while the shelf empties. This is the simplest failure mode, and also the most common. It requires no technology to detect, just someone physically checking the shelf.
Five OOS Audit Methods Compared
FMCG brands have more options than ever for running out of stock audits. Each method has distinct strengths and trade-offs. Understanding these differences is important because many brands combine several methods for the best coverage.
| Method | Speed | Cost per Store | Accuracy | Scalability | Can Fix on the Spot |
|---|---|---|---|---|---|
| Manual shelf audit (field rep) | Same day | £30-60 (loaded cost) | High | Low (capacity-limited) | Yes |
| POS / zero-sales anomaly | Near real-time | Low (data cost only) | Medium (misses phantom inventory) | High | No |
| Computer vision (cameras/AI) | Continuous | Medium (infrastructure) | High | Medium (requires hardware) | No |
| Crowdsourced / shopper-led | 24-48 hours | £8-15 per store | High (photo-verified) | High | Sometimes |
| Blended (field + crowd) | Varies | Mixed | Highest | High | Partially |
Manual shelf audit
A field rep physically walks the shelf and checks each position during a store visit. This has been the industry standard for decades and remains the most direct method for CPG brands auditing stores they don’t own. The rep can fix problems on the spot (requesting stock replenishment, correcting facings, flagging missing POS to the store manager).
The limitation is coverage. Many brands can only audit 10-15% of their store estate in any given month due to field team capacity constraints. Low coverage means execution gaps go undetected for weeks.
POS data and zero-sales anomaly detection
When a product that normally sells every day suddenly shows zero sales for two or more consecutive days (while the inventory system still shows units available), the most likely explanation is that the product is in the back room rather than on the shelf. This method is cheap and scalable, but it cannot catch phantom inventory and it tells you nothing about facings, pricing, or display compliance.
Computer vision
About 14% of FMCG store audits are now conducted via robots or drones equipped with AI, a share that is growing quickly as costs fall. These systems can continuously monitor shelf conditions, but they require significant infrastructure investment and retailer cooperation.
Crowdsourced and shopper-led audits
On-demand platforms let brands commission store visits whenever they need them. Auditors complete photo-verified tasks through a mobile app, and results are reviewed and consolidated in a dashboard. The main advantage is flexibility: brands can quickly scale coverage up or down without maintaining a dedicated field team. For a deeper look at how this works in practice, see this guide to shopper-led store audits.
Practitioners on retail industry forums frequently note that crowdsourced audits are particularly useful for challenger brands that cannot justify the cost of a full field team but still need national visibility into shelf conditions. The flat per-store pricing (typically £8-15 versus £30-60 for a loaded field rep visit) makes the economics work at much smaller scale.
Blended approach
The strongest FMCG brands pair dedicated field reps for priority stores with crowdsourced auditors for the long tail. This combination provides both depth (reps who know the store and can negotiate with managers) and breadth (coverage across hundreds of locations). For a detailed comparison, see our guide on field teams vs. crowdsourced audits.
The detection-to-correction window
One factor that practitioners consistently emphasise is that detection speed alone is not enough. What matters is how quickly detection triggers correction.
A manual audit with a next scheduled visit might take 4-7 days on average from the moment an out of stock opens to the point someone does something about it. A same-visit audit corrects the problem in minutes, but only catches what the rep notices at that specific moment. A shelf that looks correct at 9am and is depleted by 2pm records as compliant.
The value of any audit method is ultimately measured by how fast it closes the loop between finding a problem and fixing it.
What an Out of Stock Audit Checks: The Audit Checklist
Most FMCG brands structure their audits around what the industry calls the “Perfect Store” framework. This covers the core dimensions of in-store performance and gives field teams and auditors a consistent checklist.
Product presence: Is each listed SKU physically on the shelf? This is the most basic check and the one that generates the headline OOS rate.
Facing count: Does the product have the correct number of facings as agreed in the planogram? Reduced facings mean faster depletion and increased OOS risk.
Shelf position: Is the product in the right bay, at the right height, in the right adjacency? A product moved to a bottom shelf or buried behind competitors might as well be out of stock for many shoppers.
Pricing: Is the correct shelf-edge label present? Is the displayed price accurate? Pricing errors can block sales just as effectively as physical absence.
Secondary placement: Are agreed end-caps, gondola displays, or promotional bays in place? These check points matter especially during promotional campaigns.
Condition: Is the packaging undamaged? Is the product within its use-by date? Damaged or short-dated stock can deter purchase even when the product is technically available.
For more detail on the broader compliance picture, see the complete UK FMCG shelf compliance guide.
Key Metrics and Benchmarks
OOS rate formula
The standard calculation is straightforward:
OOS Rate = (Missing SKUs ÷ Total Expected SKUs) × 100
If a brand has 20 SKUs listed in a store and 3 are missing from the shelf, the OOS rate for that visit is 15%.
Industry benchmarks
- Global FMCG average: 8% OOS rate
- Best-in-class: Below 5%
- During promotions: Approximately 10%
- UK non-compliance (all in-store execution): Up to 50% (POPAI UK)
- Recent PlanoIQ audit data: Only 31% of audits scored an A rating. Low stock appeared in 46.6% of audits, and out of stock issues appeared in 29.1%.
For US context, Purdue University reported that consumers experienced a 9.5% food out-of-stock rate in 2024, down from 12.3% in 2023 and 19.3% in 2022 (the latter reflecting lingering pandemic supply chain disruption).
The Perfect Store score
Beyond the raw OOS rate, most major FMCG companies track a composite “Perfect Store” score that rolls up on-shelf availability, OOS rate, planogram compliance, pricing accuracy, and promotional display into a single performance metric. This score becomes the basis for field team targets and retailer performance conversations.
How UK FMCG Brands Use OOS Audit Data
Retailer negotiations
Audit evidence transforms vague complaints into concrete conversations. Instead of telling a buyer “we think we have availability problems,” a brand can present store-by-store photo evidence showing specific execution failures. This shifts the conversation from blame to problem-solving.
Range review defence
This is where OOS audit data becomes genuinely strategic. When a retailer’s data shows declining sales velocity for a SKU, the default assumption is that consumers are losing interest. Audit data can prove the opposite: sales dropped because the product was missing from the shelf 29% of the time, not because demand evaporated.
Trade spend accountability
Brands invest heavily in promotional activity with retailers, often paying premium rates for featured positions, price promotions, and secondary displays. Without audit verification, there is no way to confirm that what was paid for was actually delivered. OOS audit data closes this accountability gap.
NPD protection
New product launches represent a period of extreme vulnerability. MIT research found that during the first few months following product introduction, there is a high frequency of out of stocks, which reduces the product’s availability on the retailer’s shelf and drops the service level at exactly the moment when trial and repeat purchase matter most.
Brands launching new SKUs should treat the first 90 days as an intensive audit period. For a structured approach to this, the new SKU launch checklist covers both the digital and physical shelf.
Pairing physical and digital shelf data
Increasingly, UK FMCG brands are connecting in-store audit data with digital shelf performance. A product that is out of stock in 15% of physical stores may also suffer from low review counts and poor retailer search ranking online. The most effective brands audit both channels and use the combined picture to drive action.
Related Glossary Terms
Understanding the full vocabulary around out of stock audits helps brand teams communicate precisely with retailers and field teams:
- On-shelf availability (OSA): The percentage of time a product is available to buy on the shelf. The inverse of OOS rate.
- Phantom inventory: Stock the system says exists but that cannot be found or sold.
- Void: An empty shelf position where a product should be displayed.
- Planogram compliance: Whether the shelf matches the agreed layout for product positioning and facings.
- Shelf share: The proportion of shelf space occupied by a brand relative to the category.
- Facing count: The number of product units visible on the shelf front.
- Perfect Store score: A composite metric covering availability, compliance, pricing, and display.
- Promotional compliance: Whether promotional displays, pricing, and POS materials match the agreed plan.
- Digital shelf audit: Checking product page content, pricing, availability, and reviews on retailer websites.
For UK FMCG brands that need out of stock audit coverage across multiple retailers without building a dedicated field team, Brand Allies offers managed in-store compliance checks using a community of 250,000+ UK shoppers who can verify shelf conditions with photo evidence.
Frequently Asked Questions
What is the difference between a stock audit and an out of stock audit in FMCG?
A stock audit is typically an internal exercise where a retailer or warehouse counts its own inventory. An out of stock audit in FMCG works from the brand side: a manufacturer checks whether its products are physically present and correctly displayed on retailer shelves that the brand does not own or control.
What is a good OOS rate for FMCG brands?
The global average is around 8%. Best-in-class performance is below 5%. During promotions, OOS rates typically jump to around 10%. Any brand consistently measuring above 8% has significant room for improvement through better audit coverage and retailer engagement.
What causes most out of stocks in FMCG?
Between 70% and 90% of out of stocks are caused by in-store replenishment failures, not upstream supply chain problems. The product is often in the store’s back room but has not been brought to the shelf. Harvard Business Review research puts the figure at 72% caused by faulty in-store ordering and replenishment practices.
What is phantom inventory and why does it matter for OOS audits?
Phantom inventory is stock that the retailer’s system says exists but that cannot be physically located in the store. Because the system sees no gap, no reorder is triggered, and the shelf stays empty indefinitely. Only physical audits (or zero-sales anomaly detection) can catch phantom inventory problems.
How often should FMCG brands run out of stock audits?
It depends on the brand’s store estate and the stakes involved. Priority stores (high volume, key accounts) often justify weekly or fortnightly checks. Longer-tail stores might be audited monthly or during key promotional windows. The critical point is that infrequent audits miss problems that accumulate over days.
Can OOS audit data help during retailer range reviews?
Yes, and this is one of the most strategic uses of audit data. If a product shows declining sales velocity, audit evidence can demonstrate that the decline was caused by shelf execution failures (the product was missing or misplaced) rather than genuine demand weakness. This distinction can save a listing.
What is the “Perfect Store” framework?
The Perfect Store is an industry-standard framework that FMCG brands use to score retail execution across multiple dimensions: on-shelf availability, OOS rate, planogram compliance, pricing accuracy, and promotional display. Most major manufacturers use some version of this framework to set field team targets and benchmark retailer performance.
How do crowdsourced OOS audits compare to traditional field teams?
Crowdsourced audits typically cost £8-15 per store (flat rate) versus £30-60 for a loaded field rep visit. They offer much wider geographic coverage and faster deployment. The trade-off is that crowdsourced auditors generally cannot negotiate with store managers or physically restock shelves in the way a dedicated field rep can. Many brands use a blended approach: field reps for top-priority stores, crowdsourced auditors for the rest.