TL;DR: Retailer visibility for FMCG brands measures how easily products are seen, found, and chosen within retailer controlled environments, both physical stores and online platforms. It spans five connected systems: physical shelf presence, digital shelf performance, review driven social proof, packaging and sensory design, and PR and media strategy. In the UK, where four grocers control 66.5% of the market and own label is outgrowing branded lines, managing visibility across all dimensions is no longer optional. It determines whether products sell, rank, and survive the next range review.
Retailer visibility is one of those terms that sounds self explanatory until you try to measure it. Ask three people on an FMCG brand team what it means and you’ll get three different answers. The trade marketing manager thinks about shelf position and POS materials. The e-commerce lead thinks about search ranking on Tesco.com. The brand manager thinks about star ratings and review counts.
They’re all right. And that’s the problem most brands face: these dimensions of visibility are deeply connected, but they’re usually managed in silos.
This guide brings them together. Every term and concept below is defined through the lens of UK grocery retail, with hard numbers where they exist, so brand teams can speak a common language about what visibility actually means and why gaps in one dimension tend to cascade into others.
If your product reviews need attention, explore review services designed specifically for UK FMCG brands selling through major grocery retailers.
What Is Retailer Visibility?
Retailer visibility for FMCG brands is the degree to which a brand’s products are seen, found, and chosen within retailer controlled environments. That includes physical shelf space in supermarkets, product listings on retailer websites, and the social proof (reviews, ratings, user generated content) that influences both algorithms and shoppers. It also extends to how packaging catches the eye on shelf and how PR and media campaigns drive shoppers toward the fixture or listing in the first place.
The concept matters because FMCG manufacturers have almost no visibility through their own channels when it comes to actual purchase moments. A striking SISTRIX analysis of UK search visibility found that not a single FMCG manufacturer appears in the top 25 domains for retail basket keywords. No Nestlé, no Unilever, no Kellogg’s. Shoppers find products through Tesco, Sainsbury’s, Ocado, and Amazon, not through brand websites.
This means the battle for visibility is fought entirely on retailer turf, both in store and online. Five linked systems drive it:
- Physical shelf visibility determines whether shoppers notice your product during a store visit.
- Digital shelf visibility determines whether shoppers find your product when browsing or searching online.
- Review and ratings visibility influences both algorithmic ranking and shopper confidence across every digital touchpoint.
- Packaging and sensory design shapes whether a product commands attention amid hundreds of competing SKUs on the fixture.
- PR, content, and media strategy creates the upstream awareness that makes shoppers look for your product in the first place.
Why does this matter more now than five years ago? The UK FMCG market is tightening. Own label ranges grew at 4.2% in 2025, ahead of branded lines, as shoppers looked to balance budgets. Shelf space isn’t expanding. Range reviews are more frequent and more ruthless. Brands that can’t demonstrate strong visibility metrics, particularly rate of sale, are getting delisted.
As one UK FMCG consultancy put it: “Staying listed is an active sport. It requires constant attention, constant energy, and a constant commitment to proving your worth.”
Physical Shelf Visibility: Key Terms
Physical shelf visibility covers everything that happens inside a retail store, from whether your product is actually on the shelf to how prominent its position is relative to competitors. Distribution alone is not enough. A product can be listed in 2,000 stores and still be functionally invisible if it’s out of stock, on the wrong shelf, or buried at ankle height.
On Shelf Availability (OSA)
The percentage of time a listed product is physically present and purchasable on the shelf. This sounds like a basic operational metric, but it’s one of the most damaging when it goes wrong.
Research from the IGD and industry analysts indicates that inventory records in grocery are typically only 50 to 60% accurate, meaning a product the system says is “in stock” may not actually be findable by a shopper. The resulting lost sales can reach 8% of revenue. In the UK specifically, 82% of shoppers reported experiencing out of stock products in store in the past 12 months, an increase of 11 percentage points year on year. Over a quarter of those shoppers said persistent stockouts would make them question their loyalty to the retailer.
For the brand, each out of stock moment is a lost sale that goes to a competitor, and a data point that drags down rate of sale ahead of the next range review. A thorough stock availability audit is the starting point for quantifying the problem.
Share of Shelf
The proportion of shelf space your brand occupies compared to competitors in the same category. Usually expressed as a percentage of total facings or linear metres. A useful rule of thumb: share of shelf should broadly align with market share. If your brand holds 15% of the category but only 8% of the facings, that gap represents a negotiation issue or an execution failure.
Planogram Compliance
The extent to which the actual shelf layout matches the agreed planogram, the diagram that specifies exactly where each product should sit. Typical compliance rates across UK grocery hover between 70 and 85%, which means up to 30% of products may be incorrectly merchandised at any given time. For a deep dive on how to measure and close those gaps, the planogram compliance measurement guide covers the formulas and benchmarks.
Spatial Planning and Sightlines
Planogram compliance tells you whether products are in the right position. Spatial planning goes further, considering how the entire fixture layout, aisle width, shelf height, and adjacent categories influence whether shoppers actually see what’s there.
Retailers and category captains use spatial planning tools to model sightlines: the angles and distances from which a shopper approaching the fixture will notice specific products. A product placed correctly according to the planogram can still be functionally invisible if a promotional end cap blocks the sightline or if the fixture is positioned at an awkward angle relative to the main traffic flow.
Practitioners on Reddit’s retail design forums report that even small changes, like repositioning a fixture 30 degrees or adjusting the height of a top shelf divider, can meaningfully change which products get noticed first. Brands don’t control store layout, but understanding how spatial planning works strengthens conversations with buyers about shelf positioning.
Eye Level Placement
The old retail maxim “eye level is buy level” has been validated repeatedly. Products placed within the shopper’s direct line of sight are significantly more likely to be noticed and considered. For most UK grocery fixtures, eye level falls between roughly 120cm and 170cm from the floor. Premium positions here are negotiated with buyers and defended through strong rate of sale data.
Facing Count
The number of individual product faces visible to a shopper looking at the shelf. More facings mean more visual impact and a higher chance of being noticed, particularly in categories where shoppers make fast, low engagement decisions (snacks, soft drinks, household cleaning).
Secondary Display and End Cap
Off shelf placements, including end of aisle displays, gondola ends, dump bins, and freestanding display units, are premium visibility real estate. They can dramatically lift rate of sale during promotional windows, but they need physical verification. Field teams from CPM International noted in 2025 that “in convenience, distribution alone is no longer enough. Gaps at front of store, chillers, and secondary sitings directly impact rate of sale.”
For brands running promotional campaigns, a display compliance audit catches execution failures before they erode ROI.
POS Materials
Point of sale materials include shelf talkers, wobblers, clip strips, header boards, and branded shelf edge labels. They draw attention to specific products within the fixture. Their effectiveness depends entirely on whether they actually get installed and stay up for the duration of the campaign, which brings us to the next term.
Sensory Cue Integration in Store
Visibility isn’t purely visual. Leading FMCG brands are experimenting with sensory cues, smell, sound, texture, to draw shoppers toward specific fixtures or products. Think of the bakery aroma piped into the front of a Sainsbury’s store, or the textured packaging on a premium gin bottle that invites touch.
For FMCG brands, the most practical applications are scented shelf strips in health and beauty aisles, textured packaging that stands out in a wall of smooth cartons, and audio cues in stores that support digital advertising formats. Sensory marketing research from the University of Oxford’s Crossmodal Research Laboratory has shown that congruent sensory cues (where the smell matches the product category, for example) can increase purchase intent by 20% or more.
The constraint is cost and retailer willingness. Most UK grocers are conservative about in store sensory additions beyond their own branded experiences. But for premium and challenger brands in categories like confectionery, fragrance, and fresh food, sensory differentiation at the fixture is worth exploring.
In Store Production Visibility
Some retailers have turned back of house processes into front of store theatre. The Marks & Spencer bakery, the Waitrose sushi counter, the in store pizza oven at certain Morrisons locations: these are examples of making production visible to shoppers.
For FMCG brands, direct in store production isn’t usually feasible. But the principle translates. Packaging with clear windows showing the product inside, transparent supply chain messaging on shelf edge materials, and QR codes linking to farm or factory videos all borrow from the same psychology: showing people how something is made builds trust and draws the eye.
One YouTube review of Morrisons’ “Market Street” concept noted that categories with visible preparation (the deli counter, the fishmonger) consistently drew higher footfall within the store than packaged equivalents in adjacent aisles, even when the packaged versions were cheaper.
Field Audit
A physical store visit to verify execution: checking availability, shelf position, pricing, POS compliance, and promotional displays. The gold standard for understanding what’s really happening at store level. A single field rep typically covers 6 to 10 stores per day.
Brands without field teams often discover problems only when sales data declines weeks later, long after the damage is done.
Perfect Store Score
A composite metric that rolls up multiple execution KPIs (availability, visibility, planogram compliance, POS presence, pricing accuracy) into a single score per store. Developed originally by Unilever and P&G for internal use, the concept has become standard across the industry. The score gives brand teams a way to prioritise which stores need intervention and track improvement over time.
If your brand needs eyes in stores but doesn’t have a dedicated field team, in store compliance services can close the gap.
Packaging as a Visibility System
Packaging is the most overlooked visibility lever in FMCG. Everything discussed in the physical shelf section above, facings, eye level placement, secondary displays, assumes the product actually catches a shopper’s attention once they’re looking at the fixture. That’s packaging’s job.
In a typical UK supermarket carrying 30,000 to 40,000 SKUs, each product gets a fraction of a second to register. Packaging design is the difference between being seen and being wallpaper.
Colour, Texture, and Window Design
Colour is the fastest processing cue the human brain handles. Research published in the Journal of Business Research has consistently shown that colour contrast relative to adjacent products on the shelf matters more than the specific colour chosen. A bright yellow pack in a sea of blue competitors will outperform a slightly better shade of blue.
Texture adds a tactile dimension. Matte finishes, embossed lettering, and soft touch coatings all create a “pick me up” response that smooth, glossy packs don’t trigger as strongly. Practitioners on packaging design forums frequently point out that shoppers who physically handle a product are significantly more likely to put it in the basket.
Clear windows that show the product inside serve double duty. They build trust (the shopper can see what they’re buying) and they differentiate on shelf in categories dominated by opaque packaging. Brands like Graze and Nakd built early shelf visibility partly through packaging transparency.
Metallised Packaging for Shelf Appeal
Metallised films and foils create a reflective, premium look that draws the eye under store lighting. They’re widely used in snacking, confectionery, and premium ready meals. The reflective surface catches light from multiple angles, which means the product stands out even when positioned at less favourable shelf heights.
The trade off is cost. Metallised substrates are more expensive than standard films, and they can complicate recyclability claims, which matters increasingly in UK grocery where retailer sustainability targets influence listing decisions. Brands considering metallised packaging should weigh the shelf visibility benefit against OPRL (On Pack Recycling Label) compliance requirements.
Premium Packaging to Increase Perceived Value
In categories where own label is gaining share, packaging is one of the few tools branded products have to justify a price premium. Heavier board weight, magnetic closures, embossed logos, and structured boxes all signal quality before the shopper reads a word of the product description.
This isn’t about over packaging. It’s about appropriate premiumisation. A brand like Tony’s Chocolonely uses distinctive shape and bold colour blocks to justify shelf price points well above own label alternatives. The packaging is the brand’s most important piece of marketing at the moment of purchase.
Promotional and Seasonal Packaging
Limited edition packaging, seasonal wraps, and promotional packs (with on pack competitions, QR code activations, or charity partnerships) create visual disruption on shelf. They give shoppers a reason to notice a product they’ve walked past hundreds of times.
The operational challenge is speed. Seasonal windows are short, and retailer listing timelines mean packaging changes need to be planned months in advance. Brands that build promotional packaging flexibility into their supply chain, perhaps through sleeve changes rather than full pack redesigns, can respond faster.
One common mistake: promotional packaging that looks so different from the core pack that loyal shoppers don’t recognise it. The best seasonal executions maintain core brand codes (colour, logo placement, shape) while adding seasonal elements that create novelty without confusion.
Digital Shelf Visibility: Key Terms
The digital shelf is where most purchase journeys now begin. Industry data consistently shows that over 60% of purchase journeys start online, even when the final transaction happens in a physical store. For FMCG brands, digital shelf visibility determines whether shoppers ever see your product when they search on Tesco.com, browse a category on Ocado, or scan a Sainsbury’s listing on their phone.
Digital Shelf
The collection of online touchpoints where a product appears within retailer controlled environments: search results pages, category browse pages, product detail pages, and “frequently bought together” recommendations. Think of it as the digital equivalent of the physical fixture, except the shelf is algorithmically sorted and changes constantly.
Retailer Search Ranking
Where your product appears in on site search results when a shopper types a category or product term into a retailer website. On Tesco.com, for example, the first page of results for “oat milk” might show 20 products. Everything below the fold, or on page two, might as well not exist for most shoppers.
Retailer search ranking is influenced by a combination of sales velocity, stock availability, content quality, review performance, and (increasingly) paid retail media. For a detailed breakdown, the retailer SEO guide covers ranking factors specific to UK grocery platforms.
Social Media and SEO for Visibility
While retailer search ranking governs what happens on Tesco.com or Ocado, broader SEO and social media work shapes whether shoppers arrive at those platforms already looking for your product.
FMCG brands with strong social media presence, particularly on TikTok, Instagram, and YouTube, create demand that translates into retailer search queries. When Little Moons went viral on TikTok in 2021, Tesco and Ocado both reported spikes in on site searches for the brand. That search activity boosted algorithmic ranking, which in turn improved organic visibility and sales velocity.
The lesson: social media doesn’t just build brand awareness in the abstract. It creates specific, measurable signals within retailer ecosystems. A product that generates high volumes of branded search queries on Tesco.com will rank better for category terms too, because the algorithm interprets that search activity as a relevance signal.
For SEO specifically, FMCG brands can’t compete with retailers for generic grocery terms. But they can own branded search and long tail terms that drive shoppers to retailer listings. “Where to buy [brand name]” queries, recipe content featuring specific products, and “best [product category] UK” articles all feed the top of the retailer visibility funnel.
Product Detail Page (PDP)
The individual product page on a retailer website containing the product image, title, description, pricing, reviews, and nutritional or ingredients information. This is where conversion happens or doesn’t. A weak PDP with a single image, a sparse description, and two reviews from 2022 will underperform a competitor’s page with rich content and 80 recent reviews, regardless of the underlying product quality.
Content Compliance
Whether the product listing on a retailer website matches the brand’s intended presentation: correct images, up to date descriptions, accurate bullet points, proper categorisation. Content drift is common, particularly after range resets or platform migrations, and it often goes unnoticed unless someone is actively monitoring.
Online Availability and Stockout
Whether the product is shown as available and purchasable on the retailer website. Online out of stocks are arguably worse than physical ones because the effects compound. When a shopper finds a product unavailable, they buy a competitor, and the retailer’s algorithm notices. Repeated stockouts erode search ranking and conversion metrics long after the shelf is refilled. The algorithm doesn’t forgive quickly.
Retail Media
Paid advertising placements within retailer platforms: sponsored product listings, banner ads on category pages, and featured placements in retailer apps. According to a Criteo study of 251 UK CMOs, revenue from retail media ads rose 24% over 12 months, and 70% of respondents identified retail media as a strategic priority. For FMCG brands, retail media is essentially paying for guaranteed visibility in environments they don’t own.
Digital Shelf Analytics (DSA)
Software tools that monitor your product’s search ranking, content accuracy, pricing, availability, and review performance across multiple retailer websites. DSA platforms give brand teams a dashboard view of their digital visibility and flag problems in near real time rather than waiting for weekly or monthly sales reports.
AI Visibility and Product Recommendations
Increasingly, retailer platforms and third party tools use AI to generate product recommendations, “frequently bought together” suggestions, and personalised search results. Brands that maintain strong review profiles, consistent content, and high conversion rates tend to be favoured by these systems. For a closer look at how AI driven recommendation engines affect FMCG product discovery, the AI visibility tool guide covers the mechanics.
Review and Ratings Visibility: Key Terms
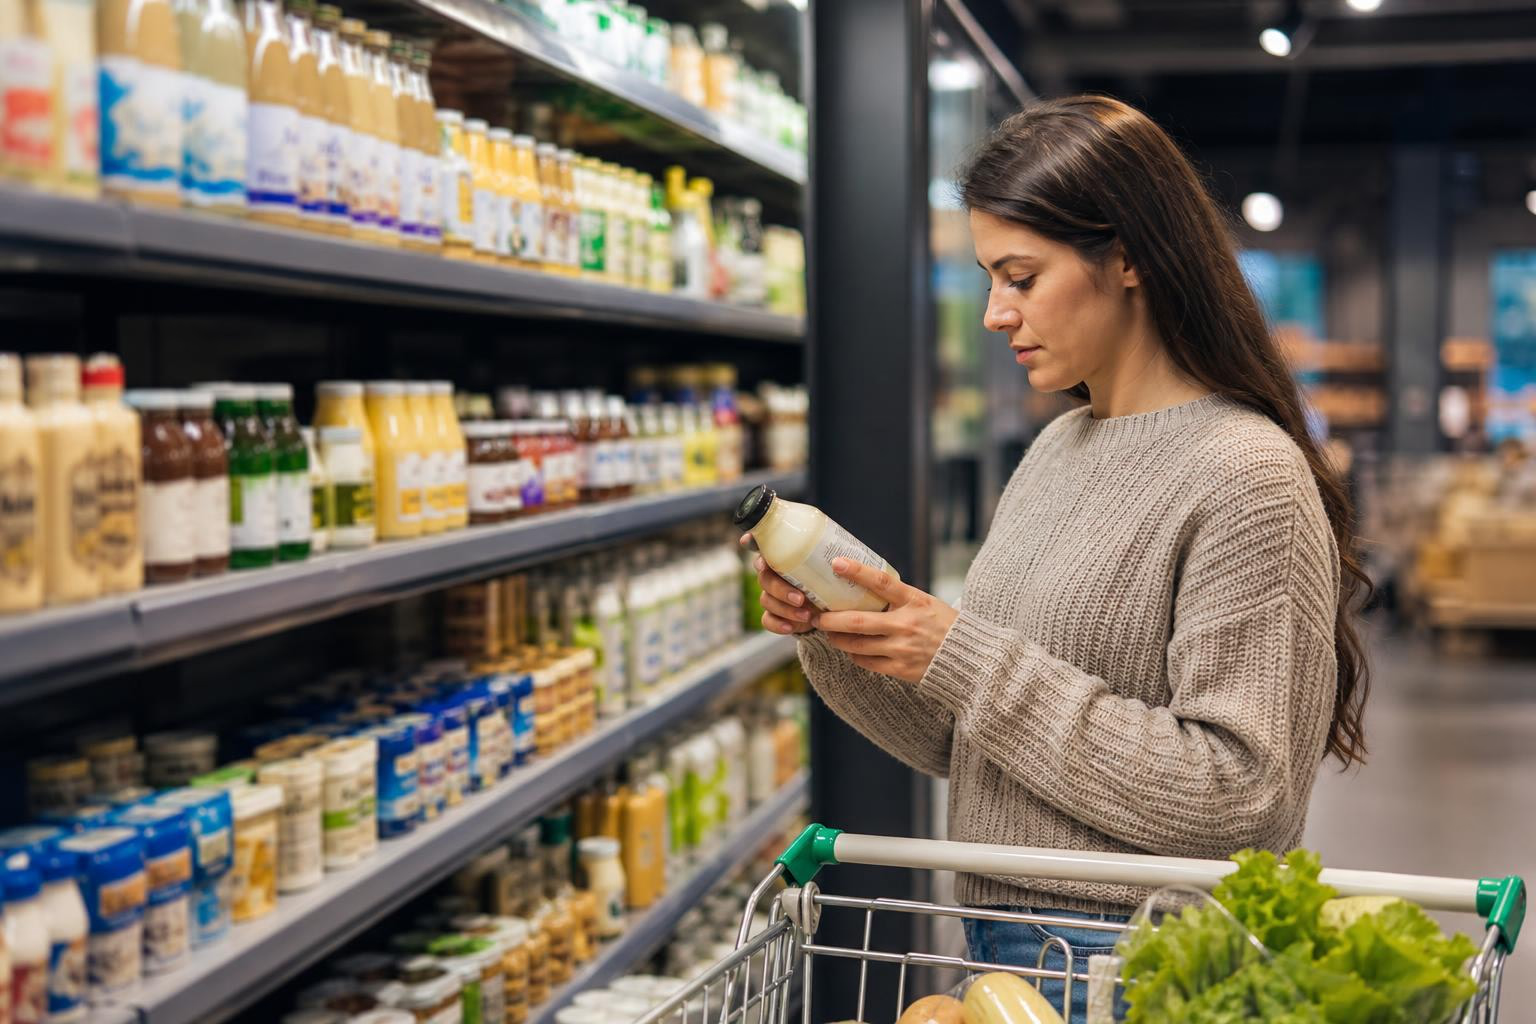
Reviews are the most under managed visibility lever in UK grocery. The average review rate on grocery retailer websites sits at roughly 0.1 to 0.3%, compared to 2 to 5% on Amazon. That means most grocery PDPs are starved of the social proof that shoppers expect and that algorithms reward.
Quarterly data from CheckoutSmart’s UK FMCG monitoring shows that even the biggest names lose traction quickly without fresh reviews and continuous monitoring. In one reporting period, KP Snacks dropped 46 places in the review performance rankings due to a 20.8 point rise in SKUs needing new reviews. Scale doesn’t protect you. Consistency does.
Star Rating
The average numerical rating displayed on a product detail page, typically on a 1 to 5 scale. Products that drop below 3.5 stars see significant conversion declines. Star rating is visible in search results on most retailer platforms, meaning it influences click through before a shopper even reaches the PDP.
Review Volume
The total number of reviews a product has accumulated on a specific retailer website. Research consistently shows that shoppers are significantly less likely to buy products with fewer than 20 to 30 reviews. Below that threshold, the star rating feels unreliable. The industry benchmark used by CheckoutSmart for UK FMCG is a minimum of 30 reviews per SKU per retailer.
Getting to and staying above that threshold requires a deliberate programme. The guide on getting more product reviews on UK retailer websites covers the practical steps.
Review Recency
How recently the latest reviews were posted. A product with 50 reviews that are all 18 months old sends a different signal than one with 35 reviews, 10 of which landed in the past month. CheckoutSmart’s “To Standard” benchmark specifies that the latest three reviews must be less than six months old. Recency matters to shoppers (who want to know the product is still good) and to algorithms (which favour recently active listings).
Verified Review
A review linked to a confirmed purchase on that specific retailer. Verified reviews carry more weight with both shoppers and retailer moderation systems. They’re harder to generate than unverified reviews because someone has to actually buy the product from that retailer, which is why scaling verified reviews across multiple retailers requires infrastructure.
Review Velocity
The rate at which new reviews arrive over a given period. A steady, consistent flow of reviews outperforms a one time spike followed by silence. Algorithms and shoppers both respond to momentum. Review velocity also acts as a leading indicator: if it drops to zero, you’ll eventually fall below recency and volume thresholds. For a deeper explanation of this metric, the review velocity guide breaks down the benchmarks.
Review Compliance (“To Standard”)
Meeting minimum thresholds for volume, recency, and rating consistency. CheckoutSmart’s benchmark for UK FMCG sets the bar at 30 reviews per SKU per retailer, with the latest three reviews less than six months old and within 1.5 stars of the average rating. Brands that fall outside these thresholds see measurable declines in conversion and search ranking.
According to Bazaarvoice data, when CPG brands actively engage with user generated content, they see a 127% lift in conversion and a 120% increase in revenue per visitor. Working with UK FMCG clients, always on review programmes have demonstrated ROI of £6 to £12 back for every £1 spent at a gross margin level.
PR, Content, and Media Strategy for Visibility
Physical shelf execution, digital shelf optimisation, and review management are all critical. But they assume the shopper already knows the product exists. PR, content creation, and media outreach create the upstream awareness that drives shoppers to look for your product in the first place.
This is especially important for NPD launches and challenger brands that don’t have the advertising budgets of Unilever or P&G. A well timed PR campaign can generate the initial sales velocity that triggers algorithmic momentum on retailer platforms.
FMCG PR Research and Planning
Effective FMCG PR starts with research, not with a press release. That means understanding which media outlets and journalists cover your category, what stories are trending in the trade press (The Grocer, Food Manufacture, Speciality Food), and what consumer angles will resonate.
Planning also involves aligning PR timing with retailer calendars. A feature in a national newspaper the week before a Tesco range reset can influence buyer decisions. A product review in a food magazine that lands three months after listing adds less value.
Practitioners on LinkedIn who work in FMCG PR consistently emphasise that the best results come from building journalist relationships before you need coverage, not scrambling to pitch when a launch date is already set.
PR Channel Mix and Launch Timing
The channel mix for FMCG PR has shifted dramatically. Traditional print media still matters for trade credibility (a feature in The Grocer carries weight with buyers), but consumer attention has moved to social media, podcasts, and video content.
For product launches, timing matters as much as channel selection. The strongest launches align PR activity with three moments:
- Pre listing: trade press coverage and retailer buyer briefings, typically 8 to 12 weeks before products hit shelves.
- Launch week: consumer PR, social media, influencer partnerships, and in store sampling timed to create a visible spike in awareness and trial.
- Post launch: sustained content (recipe features, user generated content, review generation) that maintains momentum past the initial window.
Brands that front load all their PR into launch week and then go quiet often see a sharp drop off in rate of sale once the initial buzz fades. The algorithm notices.
Content Creation and Media Outreach
Content creation for FMCG visibility means producing material that serves both consumer engagement and retailer relationship goals. That includes product photography optimised for retailer PDPs, recipe content that features the product in context, behind the scenes production content (sourcing stories, founder interviews), and data driven thought leadership for trade media.
Media outreach should target three audiences simultaneously: consumers (to drive awareness and trial), trade press (to influence retailer buyers and category managers), and digital platforms (to generate backlinks and social signals that support broader SEO).
The most effective FMCG content programmes create assets that work across multiple channels. A single factory visit, for example, can yield a trade press feature, a social media video series, retailer PDP imagery, and an email campaign to the shopper community.
Event Marketing and In Store Sampling
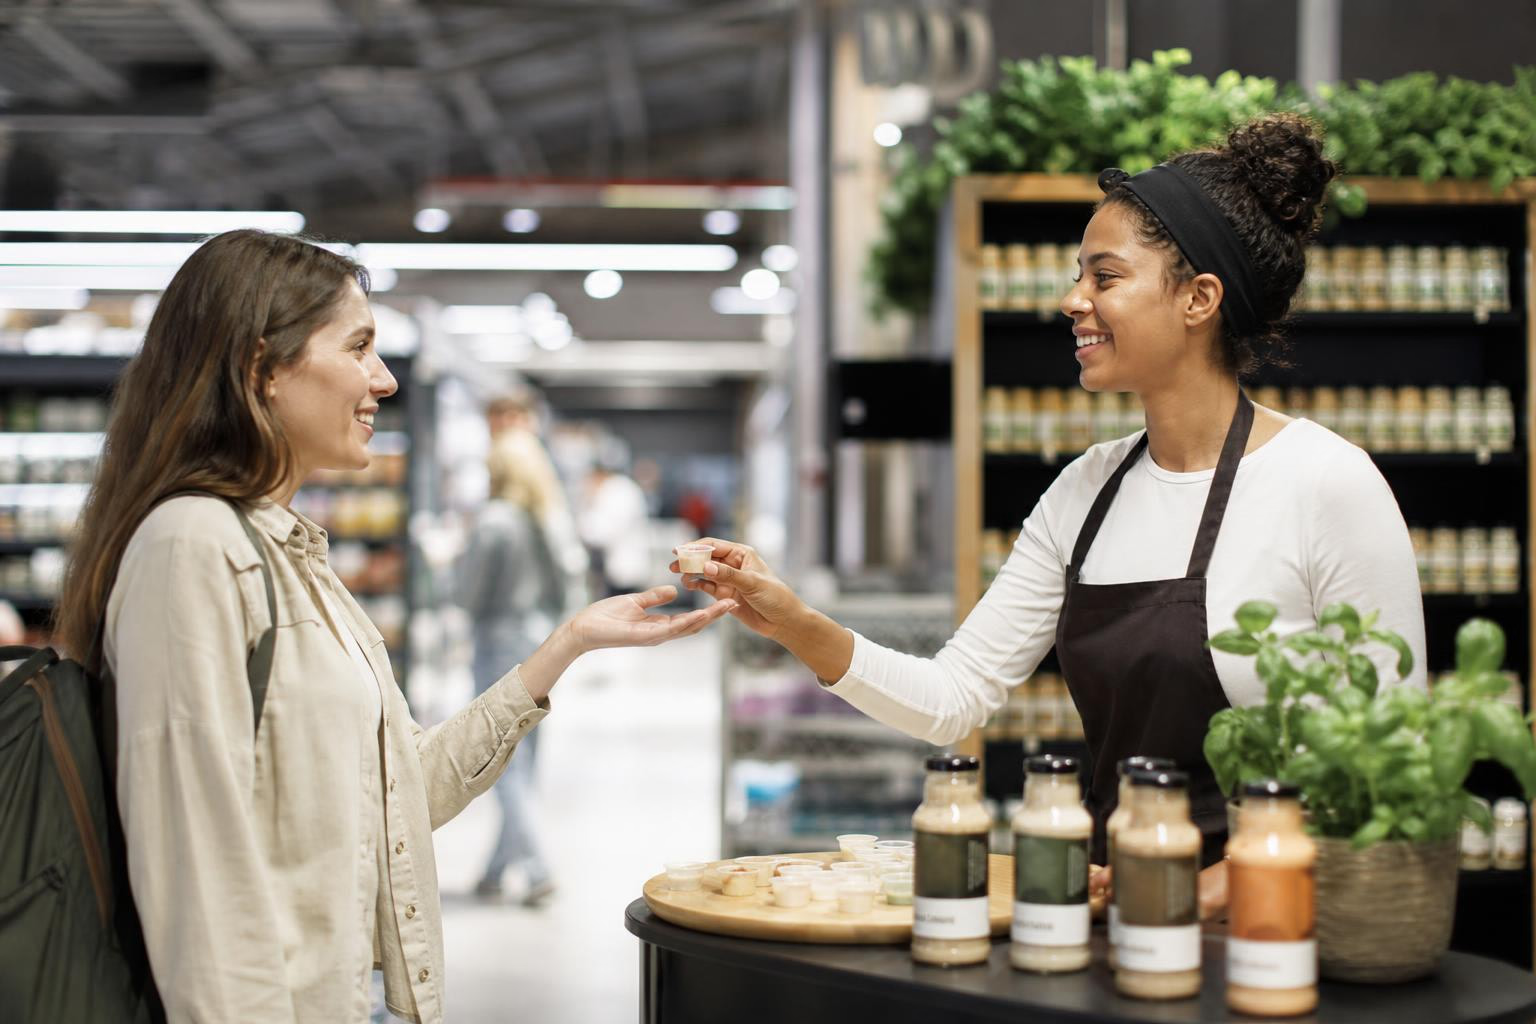
Sampling remains one of the highest converting visibility tactics in FMCG. A shopper who tries a product in store is far more likely to purchase it, and the presence of a sampling stand creates a visual event that draws attention to the category fixture.
In the UK, sampling programmes through retailers like Costco, Waitrose, and Morrisons have demonstrated conversion rates of 25 to 35% among shoppers who taste a sample. For NPD launches, pairing sampling with a review generation programme creates a virtuous cycle: trial drives purchase, purchase enables verified reviews, reviews boost digital visibility, digital visibility drives further trial.
The challenge is scale. Sampling is labour intensive and requires retailer approval for each store. Brands working with shopper activation agencies can execute sampling and review generation simultaneously, reducing the cost per acquired review.
Event marketing beyond the store (food festivals, trade shows, pop up experiences) builds awareness that feeds into retailer visibility indirectly. Brands that generate buzz at events like the BBC Good Food Show or Speciality and Fine Food Fair often see upticks in retailer search queries in the following weeks.
Open Kitchen Design and Visible Production: Lessons for FMCG
The restaurant industry’s shift toward open kitchen design, where diners can watch their food being prepared, offers a useful framework for FMCG brands thinking about visibility and trust.
Open kitchens work because they signal transparency, quality, and craftsmanship. The customer sees the care that goes into their meal, and that visibility creates perceived value.
FMCG brands can’t install glass walls in factories at the point of purchase. But the principle of turning back of house processes into customer facing experiences applies in several practical ways:
- Packaging windows that show the product inside (used effectively by brands like Graze, Emily Crisps, and many premium pet food brands).
- QR codes on pack linking to short videos of production, sourcing, or quality testing.
- “Made in” and origin stories prominently featured on shelf edge materials and PDPs.
- In store demonstrations where brand ambassadors show how a product is made or used, creating a mini “open kitchen” experience at the fixture.
A YouTube walkthrough of Whole Foods Market’s UK stores highlighted how brands with visible production stories (clear packaging, origin labels, farm partner imagery) consistently occupied premium shelf positions, suggesting that retailers themselves value production transparency as a category differentiator.
For brands selling through multiple retailers, maintaining consistent production visibility messaging across physical and digital touchpoints reinforces the quality signal that justifies price premiums over own label alternatives.
Broader Visibility Concepts
Some terms don’t fit neatly into “physical” or “digital” because they operate across both, or they determine whether you have any shelf space at all.
Range Review
The retailer process that decides which products keep their shelf space, which get delisted, and which new products earn a listing. Range reviews happen on a category by category basis, typically annually or biannually, though some retailers run them more frequently. Brands that can demonstrate strong on shelf availability, healthy rate of sale, and solid promotional ROI have a much stronger case for retaining their space. Brands that can’t will lose it.
This is where visibility connects directly to survival. Every metric discussed in this guide feeds into your performance story at range review time.
Rate of Sale (RoS)
The volume of product sold per store per week, sometimes expressed per facing per week. Rate of sale is the metric retailers care about most. If your RoS falls below the buyer’s expectations for the category, you will be delisted, often with very little warning. Strong visibility across all dimensions (shelf, digital, reviews, packaging, PR) feeds into rate of sale. Weak visibility starves it.
NielsenIQ documented $82 billion in lost US CPG sales in 2021 alone due to on shelf availability failures, equivalent to 7.4% of total category sales. While the US figures are the most cited, the same dynamic plays out in UK grocery at a proportional scale.
Category Management
The retailer’s process for organising and optimising product assortments within a category. Understanding how a retailer structures its categories helps brands position themselves for better visibility within the fixture and the digital taxonomy. Category captaincy, where a brand advises the retailer on category strategy, is the ultimate visibility advantage but is available only to the largest players.
Share of Voice (SOV)
A brand’s proportion of total category communication and advertising. In the context of retailer visibility, SOV increasingly means share of retail media spend and presence across retailer owned channels (newsletters, app promotions, in store radio). PR coverage and social media share of conversation also contribute to SOV, particularly for challenger brands that can’t match incumbents on media spend.
Omnichannel Visibility
Aligning physical and digital shelf presence so that the brand experience is consistent regardless of where the shopper encounters the product. A product that ranks well on Tesco.com but is out of stock in Tesco Express creates a frustrating disconnect that erodes trust and rate of sale.
Visible Brand Differentiation
In a market where own label is growing faster than branded, visibility alone isn’t enough. The product has to look and feel different enough to justify the price premium. This is where packaging design, production transparency, sensory cues, and storytelling converge.
Brands that achieve visible differentiation, think Innocent’s distinctive bottle shape, Tony’s Chocolonely’s unequal bar segments, or Method’s sculptural cleaning product bottles, create what retail designers call “shelf disruption.” The product breaks the visual pattern of the fixture, forcing the shopper’s eye to stop and engage.
This isn’t a luxury consideration. For brands competing against retailer own label in 2026, visible differentiation is a survival requirement.
Why Retailer Visibility Matters for UK FMCG Brands Specifically
The UK grocery market has characteristics that make retailer visibility uniquely high stakes for branded FMCG.
Extreme concentration. The combined market share of the Big Four (Tesco, Sainsbury’s, Asda, Morrisons) was 66.5% in December 2025, with Tesco alone holding 28.7%. Losing visibility within one of these retailers doesn’t just reduce sales in that chain. It can reshape your entire P&L.
Own label pressure. Retailer own label ranges are growing faster than branded products. Shoppers balancing budgets are switching, and retailers are giving their own brands better shelf positions. Every facing that goes to a retailer’s own range is one a branded product lost.
Shrinking shelf space. Store formats are not getting bigger. Convenience retail is growing, with smaller fixtures and faster shopper missions. CPM International observed that “with faster shopper missions and limited attention in store, availability and visibility at key moments are critical.”
Intensifying range reviews. Retailers are becoming more data driven and more willing to delist underperformers. The visibility metrics covered in this guide (OSA, share of shelf, digital search ranking, review scores) are increasingly the evidence brands need to present during these reviews.
Digital first shopping behaviour. Over 60% of grocery purchase journeys now start online, whether the final purchase happens digitally or in store. Brands invisible on retailer websites are invisible to a majority of shoppers before they even enter a store.
As The Food Marketing Experts, a UK FMCG consultancy, put it in a 2025 article: “The visibility, the volume, the credibility that comes with seeing your product on the shelves of Waitrose, Tesco, Sainsbury’s or Ocado, it changes everything.”
How to Improve Retailer Visibility
Improving retailer visibility for FMCG brands is not a single initiative. It’s an ongoing discipline across multiple fronts.
Physical shelf: Run regular in store compliance audits to catch availability gaps, missing POS, and planogram deviations before they show up in your sales data. Prioritise high traffic stores and convenience formats where execution failures have the highest impact on rate of sale.
Digital shelf: Monitor retailer search ranking, content accuracy, and online availability across your key retailers. Invest in retail media strategically, particularly around NPD launches and promotional windows when algorithm signals matter most.
Reviews and ratings: Build an always on review generation programme that maintains volume, recency, and quality across every SKU on every retailer. Don’t treat reviews as a one time project. Review performance decays without continuous replenishment.
Packaging: Audit your pack design against competitors on the actual fixture, not just on a screen. Test colour contrast, texture, window placement, and premium cues in the context of the shelf environment your product actually sits in. Seasonal and promotional packaging variants can create periodic disruption that re engages lapsed shoppers.
PR and content: Align media outreach with retailer listing calendars and promotional windows. Build a content engine that serves consumer awareness, trade credibility, and digital SEO simultaneously. Pair sampling programmes with review generation to create compounding visibility effects.
Range review readiness: Treat every visibility metric as evidence for your next buyer conversation. Rate of sale, OSA, promotional ROI, and review scores all contribute to the case for keeping and expanding your shelf space.
See how Brand Allies helps FMCG brands build visibility through verified reviews, in store audits, and shopper activation across UK retailers.
Frequently Asked Questions
What is retailer visibility in FMCG?
Retailer visibility refers to how easily and frequently a brand’s products are seen, found, and chosen within retailer controlled environments. This includes physical shelf presence (position, availability, signage), digital shelf performance (search ranking, content quality, online availability), social proof (reviews, ratings, user generated content), packaging design, and PR and media strategy. All these dimensions work together to determine whether a product gets noticed and purchased.
How do reviews affect retailer search ranking?
Reviews influence retailer search algorithms in multiple ways. Higher review volumes and better star ratings signal product quality and popularity, pushing products higher in on site search results. Review recency also matters: fresh reviews indicate an active, in demand product. Products with low review counts or stale reviews tend to rank lower, reducing the visibility that drives further sales.
What is a good number of product reviews per SKU?
The widely referenced UK FMCG benchmark is a minimum of 30 reviews per SKU per retailer. Below that threshold, shoppers tend to view the star rating as unreliable, and conversion rates drop measurably. The latest three reviews should also be less than six months old to maintain recency signals.
How do range reviews affect brand visibility?
Range reviews are the retailer process that decides which products stay on shelf and which get removed. Brands with weak visibility metrics (low rate of sale, poor on shelf availability, thin review coverage) are the most likely to be delisted. Losing a listing eliminates visibility entirely, both in store and online, making range review survival the ultimate visibility outcome.
What is the difference between physical and digital shelf visibility?
Physical shelf visibility concerns in store factors: shelf position, facing count, POS materials, secondary displays, and stock availability. Digital shelf visibility concerns online factors: search ranking on retailer websites, product detail page quality, review performance, and online availability. Both matter because over 60% of purchase journeys start online, but the majority of grocery sales still complete in physical stores.
Why is on shelf availability so important for FMCG visibility?
When a product is out of stock, the sale goes to a competitor immediately. But the damage extends beyond that single transaction. Repeated stockouts reduce rate of sale data, weaken the brand’s position in range reviews, and (online) erode search ranking algorithmically. Inventory records in grocery are typically only 50 to 60% accurate, meaning stockouts often go undetected without physical audits.
What is a perfect store score?
A perfect store score is a composite metric that combines multiple execution KPIs, including availability, shelf position compliance, POS presence, and pricing accuracy, into a single score for each store. It gives brand teams a way to identify underperforming locations and prioritise field team visits where they’ll have the most impact on sales.
How does retail media fit into FMCG visibility strategy?
Retail media provides paid visibility within retailer platforms through sponsored product listings, banner placements, and featured positions. With 70% of UK CMOs identifying retail media as a strategic priority, it’s becoming an essential complement to organic visibility efforts. Retail media is particularly valuable during NPD launches and promotional periods when establishing early sales velocity and algorithmic momentum matters most.
How does packaging design affect retailer visibility?
Packaging is the final visibility filter at the moment of purchase. Colour contrast relative to competitors, tactile textures that invite handling, clear windows showing the product, and premium finishes like metallised films all influence whether a shopper notices and picks up a product. For brands competing against own label, distinctive packaging design is often the primary tool for justifying a price premium and maintaining shelf space.
Does PR and social media activity affect retailer visibility?
Yes, and the connection is more direct than many brands realise. Social media virality and PR coverage drive branded search queries on retailer platforms. Those search queries signal relevance to retailer algorithms, boosting organic search ranking. Sampling events and media features also drive trial purchases that create the initial sales velocity needed to establish algorithmic momentum, particularly important during NPD launches.